

Both Apple and Facebook have just announced their results for the first three months of 2014.
So how do they compare?
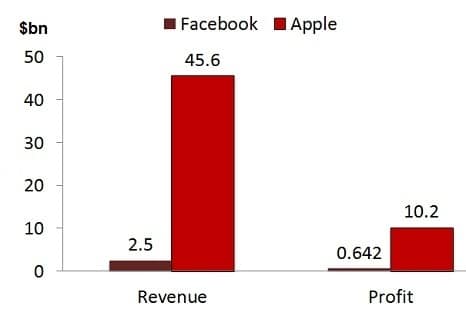
Apple’s revenue in the three months to 29 March was $45.6bn.
Facebook’s was $2.5bn, meaning Apple’s made around 18 times more money than Facebook over those three months.
Apple’s profits were $10.2bn, versus Facebook’s $642m.
I’ve created this chart so you can visualise quite how significant those differences are:
Facebook vs Apple – revenue and profits in $bn
NOW READ: Google loses $22bn in value on 6% share drop. What’s the market so worried about?
OR TRY THIS: These are the five fastest-growing tech companies in the UK
![]()


Leave a Comment