

Nasdaq 100 is currently trading near the $16,100 level, slightly below the 50-day moving average.
This comes amid market anticipation for the release of U.S. job numbers this Friday, with expectations of profit-taking contributing to a recent 1.6% decline in U.S. indices.
There is significant debate on whether the Federal Reserve will soon cut interest rates or wait for upcoming economic data. The recent Fed meeting minutes indicated a consensus to keep interest rates higher for an extended period, negatively impacting stock indices, especially the Nasdaq 100.
The current decline may also be influenced by the performance of certain stocks, particularly Apple, which saw a 4% drop after being downgraded by Barclays. Nvidia (NVDA) also experienced a 4% decline, wiping out over $100 billion of its market value due to doubts raised by Barclays about iPhone demand.
Entering the new year, investors may need patience, waiting for strong price levels to engage in the markets. This sentiment extends beyond the Nasdaq to other key indices like Dow Jones 30, DAX, and others. With recent losses in major tech stocks, the Nasdaq declined by 1.6%, and the S&P 500 fell by approximately 0.6%, while Dow Jones saw a marginal 0.1% decrease.
The consensus currently is that the U.S. economy will avoid a severe recession, moving towards a “soft landing.” Markets are pricing in interest rate cuts later this year, hoping that inflation continues to decrease, following a peak of 9.1% in June 2022.
Investors should be cautious of potential risks when buying stock indices in 2024, as unexpected inflation shocks amid rising oil prices could pose a significant threat. The ongoing conflicts between Russia and Ukraine and the Gaza Strip add to the uncertainty. Any unexpected surge in oil prices poses a considerable risk to stocks in 2024, potentially disrupting expected interest rate cuts and the soft landing anytime.
Market valuations in the U.S. seem somewhat inflated, especially after the December highs. Current valuations leave little room for further increases, and given the overall high pricing of markets, stocks could react sharply to any negative shocks. This represents the biggest risk to stock investors in 2024, especially with recession fears dominating the markets.
Additionally, historical trends are not in favor of investors in 2024, as returns in U.S. election years tend to be lower compared to normal rates. However, there remains an opportunity for modest returns during the year if the economy moves towards a soft recession, as planned by the Fed, and begins interest rate cuts soon.
Technical analysis of the NASDAQ 100 (US100) prices
The bearish outlook for major technology companies’ future indicates that the consensus at the beginning of 2023 is that the U.S. economy is heading towards a recession after the strong increases made by the Federal Reserve in interest rates, reaching 5.25%-5.50%, the highest level since 2001.
Despite growing recession concerns in March amid the regional bank crisis, the U.S. economy surprised the markets with its resilience, urging caution before entering new investments in stock indices, especially Nasdaq 100, which is currently trading near 16,261, below the 50-day moving average, representing a strong support against price decline.
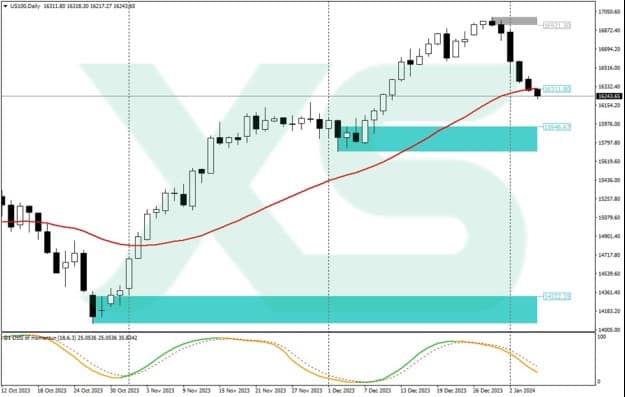
NASDAQ 100 (US100) Prices Chart –-XS.com MT4.
Technically, on the 4-hour chart, Elliott Waves indicates that the price completed the correction of the fourth wave at 16,583.75 and resumed its downward trend. T
he expected bearish movement in the fifth wave is anticipated to continue until reaching the zone of 16,410 – 16,357, representing Fibonacci retracement levels of 1.236 and 1.618, respectively. Subsequently, a corrective bullish reaction should be observed before the resumption of the decline. In the short term, as long as the price fails to breach the pivotal level at the peak of 17,165.94, there is room for further expansion of the current bearish correction.
The daily chart illustrates a rebound in the price within a descending correction from this peak, which serves as a strong key resistance area hindering further gains. Simultaneously, both the Relative Strength Index (RSI) and Moving Average Convergence Divergence (MACD) indicators show clear bearish signals after prices exit the buying climax zone.
The chart also highlights attempts by the price to test the 50-day Simple Moving Average at 16,311.80, and sustaining below it would imply further decline. If the weekly and daily closes are below this level, the Nasdaq may continue its descent next week to test the next support at $15,946.60. If breached, it would head towards testing the support level of the 200-day Simple Moving Average at $14,915.14.
However, if it bounces from any of the support levels, it could retest its all-time high at the yearly peak of $17,165.94 in a bullish scenario before potentially resuming the decline.
Support Levels: $15,946.60 – $14,915.14 – $14,322.25
Resistance Levels: $16,311.80 – $16,438 – $17,000


Leave a Comment