

The S&P 500 has historically performed poorly in the last half of February. Based on the SPDR S&P 500 Trust (SPY), it has fallen between February 15 and February 28 in 16 of the last 31 years for an average loss of -0.97%. In other words, over the last 31 years, SPY has only risen during this period 48% of the time.
Some of the declines during this period have been significant, including a 12% decline in 2020, and a 7% decline in 2001. Those figures reflect where SPY closed the period relative to where it opened. Actual drawdowns during the period are bigger. For example, in 2022 the index ETF dropped 7.5% before recovering to only being down 1.6% during the two weeks.
It is in mid-March that the S&P 500 generally starts to recover. From February 20 to March 13 the average return is -0.4%, on average over the last 31 years. And the price has moved higher in 16 of 31 years (52%).
Compare this to the period between March 14 and April 30, where SPY has increased 2.93% on average and has moved higher 74% of the time (23 of 31 years).
Should investors and traders factor in these types of statistics into their trading?
Cory Mitchell, an analyst with Trading.biz says “Each investor and trader should follow their trading system based on trade signals (entries and exits) that they tested to have a reliable edge over time. This includes understanding their own tendencies and time frame.
For a buy-and-hold investor with a long-term time horizon that means understanding the long-term annualized return of the S&P 500 is 10.5% per year. If that is the goal to achieve, don’t sweat the minor fluctuations. Shorter-term traders riding upside momentum should be long while that upward momentum persists, such as when the S&P 500 or high-momentum individual stocks are above short-term moving averages, for example.
“Similarly, they could exit and refrain from taking new long positions when prices drop and stay below those averages. Seasonality may affect such positions, but it doesn’t necessarily need to impact trading decisions.”
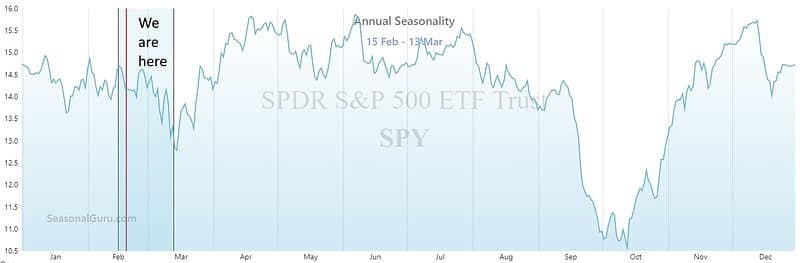
The following SeasonalGuru chart shows the seasonal tendencies of SPY throughout the year.
One issue with seasonality is that it doesn’t take into account the trends or conditions present during prior years. Some years had uptrends underway, while other years had downtrends; in some years stocks were already trading at a very high valuation, while in other years they were trading at a very low valuation, for example.
Currently, the S&P 500 is in a strong uptrend since October. Pullbacks have been limited to less than 3% during that period. This is common bull market behavior where pullbacks up to 6% are common and routine.
The Price/Earnings ratio of the S&P 500 is 22.78. Since 1990 this is s relatively common reading and doesn’t indicate an extreme over and or under value.


Leave a Comment