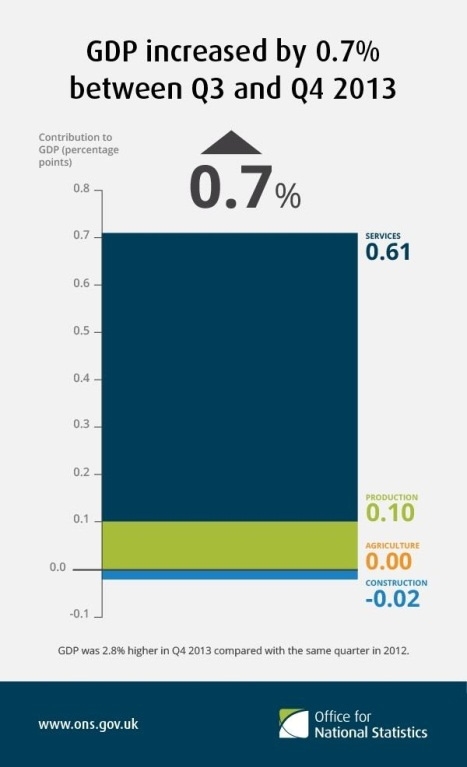
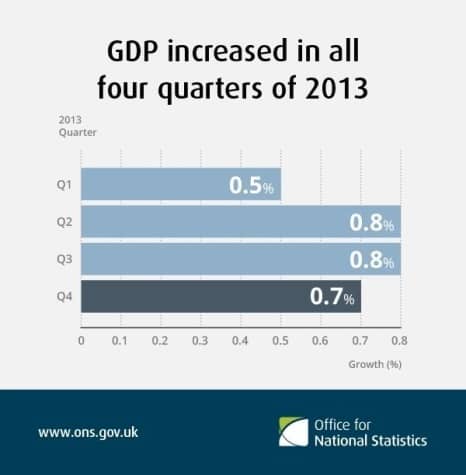
Hurrah! The UK economy grew by 0.7% in the fourth quarter of 2013, its fastest growth since 2007.
The surge in the fourth quarter has brought annual growth to 1.9%.
“We’ve seen growth in most parts of the economy,” said Joe Grice, chief economist at the ONS.
However, the figures were below the third quarter’s 0.8% growth.
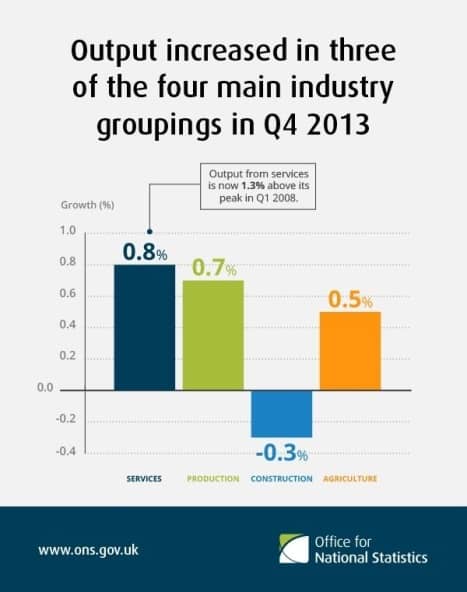
Output increased by 0.5% in agriculture, 0.7% in production and 0.8% in services. However, output decreased by 0.3% in construction.
In reaction to the figures, Chancellor George Osborne tweeted: “Growth is broadly based with manufacturing growing fastest. The job is not done & the biggest risk to recovery would be abandoning the plan.”
Here are three charts to explain the ONS figures…


Follow me: @shrutitripathi6 and @LondonLovesBiz
- Try our free newsletter
Five memes that explain Osborne’s 2014 plan


Leave a Comment