

May is historically a positive month for the S&P 500 and Nasdaq 100, but just barely, and the NYSE Composite—which includes stocks of all sizes and from different industries—has had slightly negative returns in May over the last 20 years.
Here is how the major indices have performed in May over the last 20 years.
- The S&P 500 has moved higher in May 75% of the time, or 15 out of the last 20 years. The average gain is only 0.4% though.
- The Nasdaq 100 has moved up in May 65% of the time (13 out of 20 years). The average gain is higher than the S&P 500 at 1.6%.
- The NYSE Composite has a -0.4% average return in May, even with moving up 70% of the time (14 out of last 20 years).
Cory Mitchell, an analyst with Trading.biz said, “There is a saying that says “Sell in May and go away,” which refers to the historical tendency of the stock market to be weaker during the May to end of September period. Unfortunately, if followed, this would also mean missing out on one of the best months of the year, July.
While May has some conflicting performance figures on the various major indices, overall it is a month worth staying invested in.
May has seen better performance over the last 10 years than the last 20. In the previous 10 years, the S&P 500 has moved higher in May 90% of the time (9 out of 10 years) for an average gain of 0.9%.”
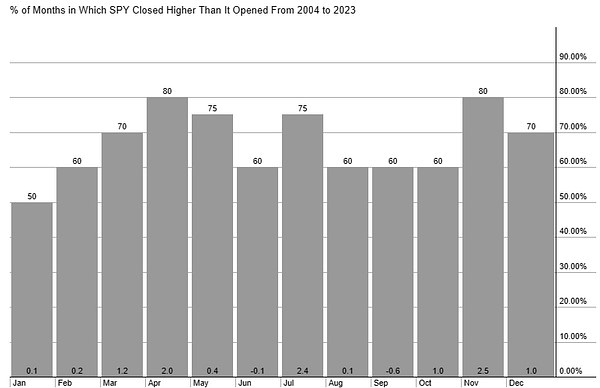
The following chart from StockCharts shows how the SPDR S&P 500 ETF has performed in May, and other months, over the last 20 years.
- Small-capitalization stocks, tracked by the Russell 2000 index, have averaged a gain of 0.6% in May, moving up 65% of the time over the last 20 years. Over the last 10 years, the statistics are slightly better, with a 0.8% average gain, moving up 70% of the time in May.
How the stock market, or any other asset, performs at certain times of the year is called seasonality. Seasonality is backward-looking as it studies prior performance. Such patterns may continue into the future, or they may not. The historical stock market performance for May doesn’t necessarily provide insight into how stocks will behave this May.
More often than not, stocks have moved up in May, especially large-capitalization stocks associated with the S&P 500.
The Nasdaq 100 doesn’t move up as often, but the average gain for the month is bigger.
The NYSE Composite, which is more representative of the “average” stock out there, also moves up most years, but the average return is negative because the down years have been bigger than the up years.


Leave a Comment