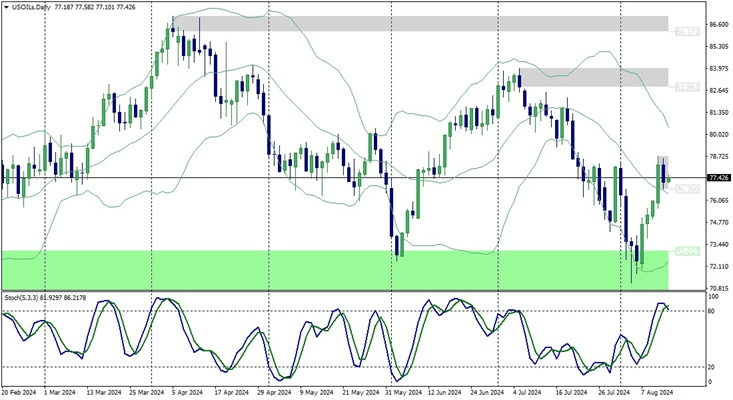
Oil prices have halted their recent gains and dropped to $77.39 at the start of today, Wednesday, following weak future demand signals from the U.S. Producer Price Index (PPI).
The International Energy Agency (IEA) has also warned of a significant oversupply risk, especially as OPEC is poised to ease production cuts.
However, geopolitical tensions, particularly concerning a potential Iranian attack on Israel, continue to support prices. It seems that markets are anticipating OPEC to maintain production cuts to support prices amid oversupply concerns.
The IEA’s monthly report showed an increase in OPEC production by 250,000 barrels per day compared to the previous month, with Saudi Arabia and Iraq being the primary drivers of this additional output.
In my view, if OPEC cancels its plans to increase production, inventories could build up by 920,000 barrels per day next year due to ample supplies from the U.S. With expectations for U.S. crude oil reserves to decline as summer demand peaks, markets are awaiting weekly inventory data today. Weak PPI numbers might lead OPEC to reverse some of its production cut decisions, which could put pressure on prices amid a risk of division within OPEC.
I also believe that the recent rise in oil prices is closely linked to geopolitical developments in the Middle East. The U.S. Department of Defense announced plans to deploy a missile submarine to the region, indicating increased readiness for potential military action. This move follows Israel’s concerns about a possible Iranian attack in response to the assassination of a Hamas leader, heightening fears of a broader regional conflict. Additionally, Russia has begun extensive evacuations in Kursk and Belgorod regions due to advancing Ukrainian forces, further adding to global instability concerns.
Despite the heightened tensions and risks, crude oil prices experienced a slight decline at the beginning of today. I think this is due to reduced risk appetite and a rebound in stock markets, especially in Japan. In my opinion, fundamental factors driving prices will remain geopolitical tensions and supply concerns, likely supporting a short-term bullish trend for crude oil prices.
Upcoming inventory data from the U.S. Energy Information Administration (EIA) will be crucial in determining future price trends. With U.S. inventories having declined for six consecutive weeks, the market will be watching for further confirmation of declines that might create strong demand zones and push prices higher.
It’s worth noting that OPEC+ production cuts are another key factor influencing crude oil and Brent prices. The organization, which represents over 37% of global oil supplies, has extended production cuts by 3.66 million barrels per day until the end of 2025, with additional voluntary cuts continuing until September of this year. These decisions have already led to reductions in global oil inventories.
While oil prices saw a brief dip after a five-day rise, driven by concerns over an oversupply if OPEC+ adds barrels as planned, market sentiment remains positive in my view. The recent IEA report, which warned of potential inventory declines in the last quarter of the year, adds to the uncertainty, suggesting that supply pressures might continue in the near to medium term.
Technical analysis of crude oil (WTI) prices
Technically on the positive side, there are two key moving averages very close to the current price. The 55-day Simple Moving Average (SMA) is at $78.56, and the 100-day SMA is at $79.83. A breach of the 100-day SMA could pave the way for a breakout above the $80 level, which would support a move towards a final upward target of around $87.12.
On the negative side, the 200-day SMA offers some support amid current profit-taking. The next target could be around $75.27. If bearish fundamental triggers emerge, the price might retest support near $72.00.

Crude Oil – WTI – Prices Chart MT4 –-XS.com
Daily Chart: Crude oil has risen to the key resistance area around $80.00. We can expect a potential pullback here, especially given the strong risk of a decline towards the $72.50 level, which represents the daily low and a key medium-term support. On the other hand, if the price manages to rise above the $80.00 resistance and sustain above it for a full day, it would enhance the bullish outlook, with potential peak levels reaching around $87.00.
Four-Hour Chart: The price broke through the first major downward trendline last Friday and gained bullish momentum with increased liquidity. The price is currently trading around the key resistance and trendline area at $78.70. For an increased bullish outlook towards peak levels, the price needs to break through and hold above this level. If it does, we might see a pullback from the peak levels in the medium term.
Hourly Chart: A rising trendline near the current levels around $77.30 is weakening the current bullish momentum. In the event of a decline, the price is likely to rely on this trendline for support and to break through and sustain above the resistance. Conversely, a decline could boost bearish momentum towards the support levels near $70.00.
Support Levels: 76.74 – 76.20 – 75.40
Resistance Levels: 77.75 – 78.30 – 79.20


Leave a Comment