

The trading dynamics on Wall Street underwent a shift in the early hours of Friday’s session. This followed Appleayd Materials (AMAT) and Ross Stores (ROST) leading the gains in US stocks yesterday.
Meanwhile, Wall Street indices continued their descent yesterday, coinciding with the ongoing rise in Treasury bond yields to their all-time highs. The Dow Jones index dipped below the 50-day moving average, joining the Nasdaq and the S&P 500 in their losses.
It’s worth mentioning that the yield on the US 10-year Treasury bond had surged in 1987, reaching its peak on October 16th of that year, a day known as “Black Monday” due to a 22% drop in the US stock market in a single day. The rise in yields and the collapse of bond values led to the crash of the US stock market. A similar situation is unfolding today as the 10-year bond yield reaches its highest level since 2007. Will “Black Monday” repeat itself?
Yesterday, leading stocks suffered further losses, appearing bearish even as the main Wall Street indices remained stable. Stocks of homebuilders and real estate companies saw a sharp decline. On the other hand, Nvidia (NVDA) managed to maintain its gains substantially, and I believe it will continue its path toward profits in the coming week. However, nearly all other artificial intelligence stocks are trading in the negative zone.
I don’t believe a repeat of “Black Monday” is likely, as the 10-year Treasury bond yield dropped a few basis points to 4.25% yesterday. This came after the giant Chinese real estate company, Evergrande, filed for bankruptcy in New York last Thursday night. Meanwhile, the markets are anticipating the earnings results of Palo Alto Networks (PANW) later today on Friday, after it dropped yesterday to its lowest level since late May.
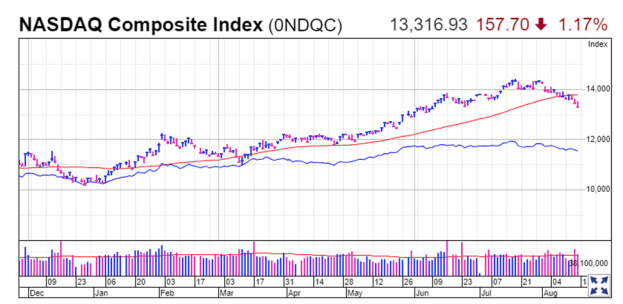
Source: The chart for Nasdaq transactions on August 18, 2023.
Above, the chart of the Nasdaq index illustrates a decline of 3.5% coinciding with the opening of trading on Friday, accompanied by a clear breach of the price below the 50-day moving average.
This suggests a likely continuation of the short and medium-term downward movement. Momentum indicators on the charts of Wall Street indices, led by the Nasdaq, show bearish reversal signals for the price, indicating the potential for a moderate descent with some sideways movement until new market drivers and events emerge.


Leave a Comment