

January and February tend to be flat months for the stock market. Over the last 20 years being invested in the S&P 500 in January and February only produced a 0.1% profit per year (for those two months).
While most stocks drift sideways during these months, there are a few stocks that have historically excelled.
These three stocks have averaged more than 5% gains, and moved higher more than 80% of the time in January and February over the last 16 years or more. Each has its own ideal trade window.
Here are the stocks, the ideal time to trade them (based on history), and the statistics those prior trades have produced as compiled by Trading.biz analyst Cory Mitchell.
MSCI Inc. (MSCI): +5.33%
- The MSCI trade is held from the January 20 open till the February 19 close.
- 5.33% average return during the trade period over the last 16 years.
- The price has finished higher during this trade period in 13 of those 16 years (81%).
That doesn’t mean every January/February is a steady climb. The largest profit during the trade period was 19.63% in 2020, while the largest loss was 9.6% in 2010.
Wheaton Precious Metals Corp. (WPM): +6.88%
- The WPM trade is held from the January 22 open till the February 12 close.
- 6.88% average return during the trade period over the last 18 years.
- The price has finished higher during this trade period in 15 of those 18 years (83%).
The largest profit during the trade period was 46.12% in 2016, while the largest loss was 10.72% in 2018.
Ulta beauty Inc. (ULTA): +8.2%
- The ULTA trade is held from the January 20 open till the March 26 close. That makes this a longer-term trade than the aforementioned stocks.
- 8.2% average return during the trade period over the last 16 years.
- The price has finished higher during this trade period in 13 of those 16 years (81%).
The largest profit during the trade period was 35.54% in 2011, while the largest loss was 30.8% in 2020.
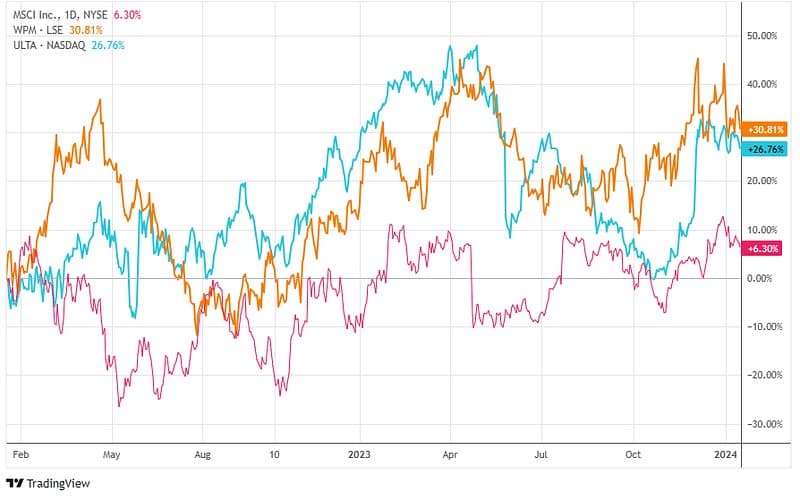
The following chart shows how all three stocks have performed over the last two years.
Seasonality and trading
This is the study of seasonality, which is finding how assets perform at different times of the year.
Seasonality looks at history to find patterns. Unfortunately, there are no guarantees those patterns will repeat with the same consistency or profitability they have in the past. Therefore, it is best to use seasonality in conjunction with other analysis and trading strategies.


Leave a Comment