

Inflation fell to 1.5% in the year to May 2014, according to the government’s Office for National Statistics.
That’s down from the 1.8% it was in the year to April 2014.
May marked the sixth month in a row that inflation has been below the Bank of England’s 2% target.
Lower inflation was driven mostly by lower flight prices and other transport costs, the ONS said, which were made more significant because of the bank holidays in April and May.
Drops in the prices of food, non-alcoholic drinks and clothes also drove down inflation.
The ONS uses the Consumer Prices Index (CPI) measure of inflation.
And this ONS chart shows how much of a rollercoaster inflation has been in the last few years:
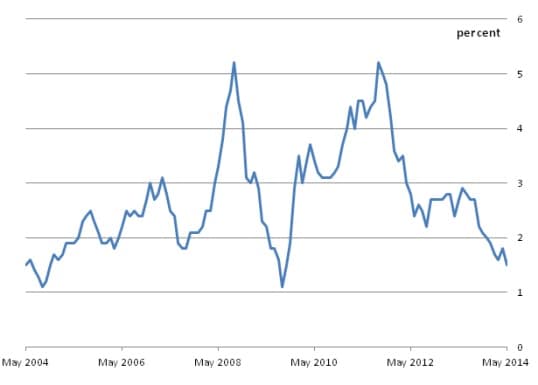
Source: ONS


Leave a Comment