

August has historically been a coin flip as to whether stock indices will go up or down.
There isn’t a strong directional bias, like there is in some months, and average returns tend to be marginally positive or negative depending on the index.
Cory Mitchell, an analyst with Stockoptionscalculator.com, summarizes stock performance in August over the last 20 years. “April, July, and November are three of the strongest months of the year. January, June, and September are a few of the worst. August is pretty much a neutral month.
“Historically it isn’t bad, but it isn’t good. Looking at several stock indices over the last 20 years, it is pretty close to 50% on whether it will rise or fall in the month, and average returns range from 0.1% on the S&P 500, -0.6% for the NYSE Composite, and 0.7% for the Nasdaq 100.
“It’s summer vacation for kids, so a lot of professional traders take time off in August. Not a bad idea.”
Over the last 20 and 10 years, here is how the NYSE Composite, S&P 500, and Nasdaq 100 have performed in August.
NYSE Composite Index
- Moved higher in August in 10 of the last 20 years (50%) with an average loss of -0.6%.
- Moved higher in August in 4 of the last 10 years (40%) with an average loss of -0.7%.
S&P 500 via SPDR S&P 500 ETF (SPY)
- Moved higher in August 60% of the time over the last 20 years, with an average gain of 0.1%.
- Over the last 10 years, it has moved higher in August 60% of the time with an average gain of 0.4%.
Nasdaq 100 via Invesco QQQ Trust (QQQ)
- Over the last 20 years, QQQ has moved higher in August 55% of the time with an average gain of 0.7%.
- Over the last 10 years, performance has been better, moving up 60% of the time with an average gain of 1.4%.
The following chart from StockCharts shows how QQQ has performed by month over the last 20 years. The number at the bottom of the column is the average gain or loss. The number at the top of the column is how often (%) the index has closed higher over the time frame in that month.
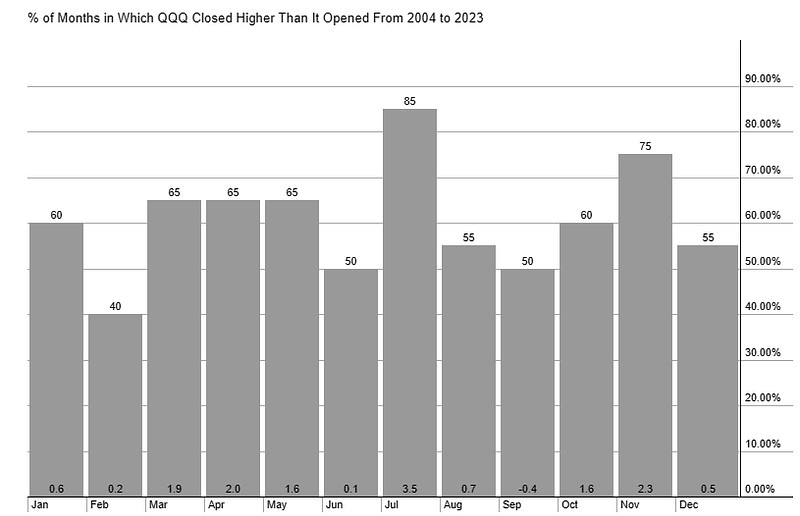 The Nasdaq 100 tends to perform a bit better in terms of average returns in August compared to the other indices, but it is pretty much a coin flip as to whether the index will rise or fall in August. Not an ideal month for investing, historically.
August is followed by September, which is one of the weakest months of the year. From an investing standpoint, if stocks are often flat in August and lower in September, making purchases toward the end of September or early October (a historically strong month) has been a historically superior strategy.
Most sector ETFs don’t perform particularly well in August either, nor does Bitcoin. With lots of people on summer vacation, that seems to be reflected in the markets.
How an asset or index performs during certain months of the year is called seasonality. It is a tool, and shouldn’t be used in isolation for making trading decisions. It highlights what has happened in the past but doesn’t predict what will happen this year.


Leave a Comment