

Is the rise in Tube fares fair to Londoners? Tweet us @Londonlovesbiz
From noisy tourists to people not standing on the right side of the escalator, Londoners get livid about a lot of things.
But nothing gets them more furious than an increase in Tube fares.
From January this year, transport fares in the capital increased by an average of 2.5%.
However, fares have been frozen in real terms for the past two years.
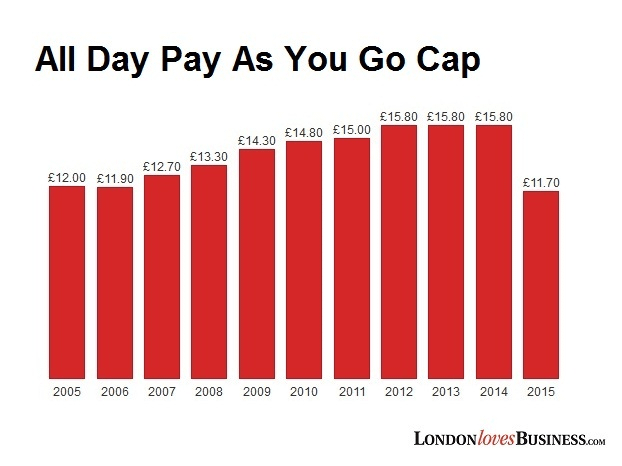
Speaking about fare rises, Transport for London told us: “The pay as you go daily caps were cut dramatically this year so they became one fifth of the cost of a 7 Day Travelcard to Zone 1.
“This is benefiting around 200,000 part time workers every day and has given people with unpredictable working patterns the guarantee they can use Oyster or contactless and not pay more in a day than one fifth of the cost of a 7 day Travelcard.”
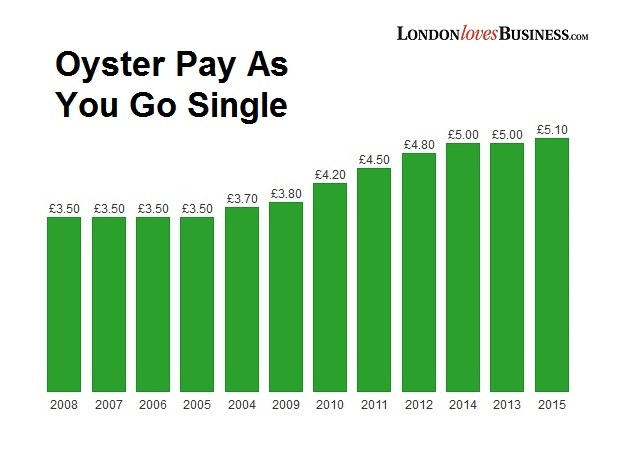
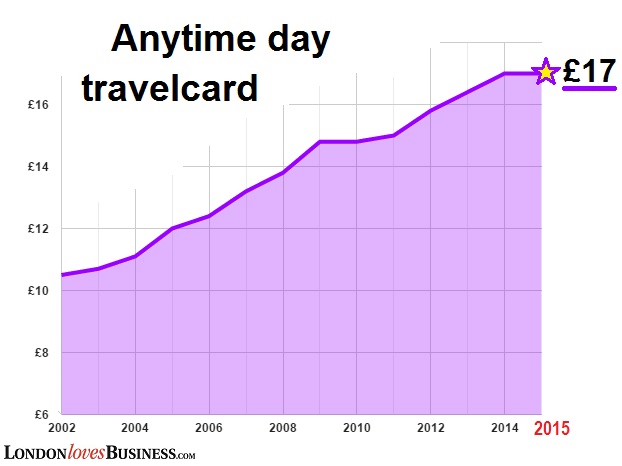
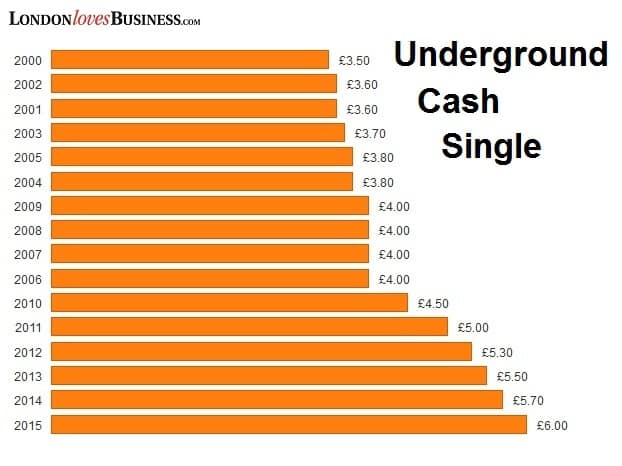
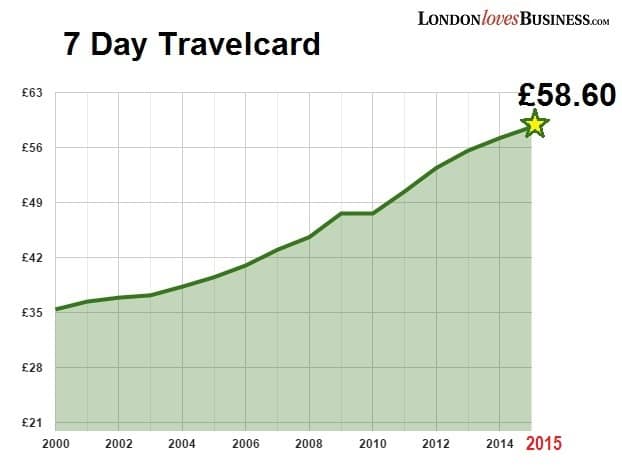
But how much have Tube fares increased since 2000? Take a look at these graphs:
Here’s what Transport for London has to say:
- Fares have been frozen in real terms for the past two years and the pay as you go daily caps were cut dramatically this year so they became one fifth of the cost of a 7 Day Travelcard to Zone 1. This is benefiting around 200,000 part time workers every day and has given people with unpredictable working patterns the guarantee they can use Oyster or contactless and not pay more in a day than one fifth of the cost of a 7 day Travelcard.
- The daily Zone 1 – 6 pay as you cap is currently cheaper today than the comparable fare 10 years ago.
- We continue to ensure our customers get the best value fare, through simpler ticketing such as contactless payments and Oyster which benefit from capping.
- During the 15-year period the compounded RPI for inflation was 53%. The fare increase on Travelcard season tickets for the same period was 65% (8% above inflation after compounding. When comparing pay as you go fares to cash fares this is 40% (10% below inflation).
Shashi Verma, director of customer experience at Transport for London (TfL) said: “TfL does not make a profit. Every penny of income from fares, secondary income from advertising, sponsorship and property and government grant is reinvested to improve London’s transport. We are delivering one of the world’s largest programmes of capital investment, which is building Crossrail, modernising Tube services and stations, improving the road network and making roads safer for cyclists and pedestrians.
“Over the past 15 years, we have upgraded the Tube to provide additional capacity and new trains and have developed one of the most extensive, reliable and green bus networks in the world. The DLR and London Overground has been transformed under our stewardship and cycling has almost trebled in the last decade.
“Continued investment is essential to keep pace with the rapidly growing population, providing access to new homes, jobs and access to health, leisure and education for all. This includes the continuing comprehensive modernisation of the Tube and road networks through new and more frequent train services, line extensions, the delivery of Crossrail, rebuilt stations, more buses and safer roads.”
Is the rise in Tube fares fair to Londoners? Tweet us @Londonlovesbiz


Leave a Comment