

Investors are faced with various investment choices, including investing in ETFs that track major indices such as the S&P 500, Nasdaq 100, and Russell 2000.
Below is a breakdown of how popular index ETFs have performed over the last 20 years.
First, here are some quick guidelines on picking an index ETF investment:
- The lowest-fee ETF is almost always the best. Each ETF is doing the same thing, tracking an index, so there is no reason to pay more than needed.
- Unless a person intends to spend a substantial amount of time learning to trade or invest, Cory Mitchell, an analyst with Trading.biz, recommends that people buy and hold index ETFs for the long term. There will be ups and downs, but over the long run, the average return for the S&P 500 is more than 10% per year. This is called buy-and-hold or passive investing. Make regular contributions to index ETFs as the indices rise and fall.
- 10% per year, on average, compounded over many years turns into large sums of money. Don’t ignore passive investing. It’s a powerful source of wealth generation.
When choosing between index ETFs, there are multiple indices to choose from, and investors don’t only need to choose one. They can invest in multiple. With that in mind, let’s look at how the S&P 500, Nasdaq 100, and Russell 2000 have performed over the last couple of decades, as well as some of their major declines.
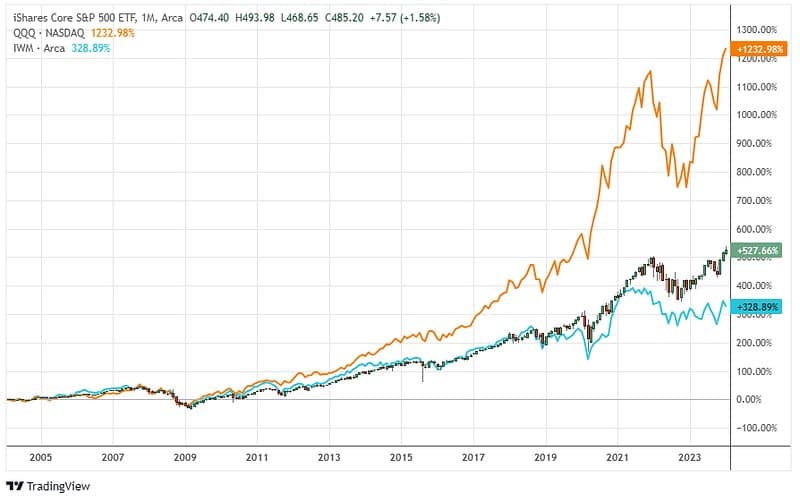
Here is the total performance (total percentage gain, including dividend reinvestment) of the indices over the last 20 years.
S&P 500 – iShares Core S&P 500 ETF (IVV): +528%
Nasdaq 100 – Invesco QQQ Trust Series (QQQ): +1233%
Russell 2000 – iShares Russell 2000 ETF (IWM): +329%
A quick snapshot like this can make it seem that the obvious choice is to invest in the Nasdaq 100 since it has the highest return.
All the ETFs have been trading since at least the year 2000, and there was a major decline that occurred from 2000 to 2003. When only looking at 20 years of data that big decline isn’t included in the calculation.
Going back to mid-2000, all three indices have similar returns: QQQ is +488%, IWM is +437%, and IVV is +426%. Because of the major crash in 2000, the Nasdaq 100 is often considered more volatile. That isn’t always the case, but was once again in 2020.
These are the ultimate decline percentages for the 2000, 2008, 2020, and 2022 stock market crashes:
- The Nasdaq 100 (QQQ) declined 84% between 2000 and 2002, while the S&P 500 (IVV) declined 49%, and the Russell 2000 (IWM) declined 40%.
- Between 2007/08 and 2009, the Nasdaq 100 (QQQ) declined 55%, the S&P 500 (SPY) declined 56%, and the Russell 2000 (IWM) declined 57%.
- In 2020, the Nasdaq 100 (QQQ) declined 30%, the S&P 500 (IVV) declined 35%, and the Russell 2000 (IWM) declined 44%.
- In the 2021-22 decline, the Nasdaq 100 (QQQ) dropped 37%, the S&P 500 (IVV) dropped 27%, and the Russell 2000 (IWM) dropped 33%.
That covers the upside and downside of how these indices have performed over the last 20 to 24 years.
While what will happen in the future is unknown, and past performance may not be indicative of future returns, hopefully, this has provided some data that can be used for deciding which of the indices to invest in.


Leave a Comment