

The Nasdaq index jumped by about 2.4%, marking its largest daily gain since April, while the Standard & Poor’s 500 index rose by 1.9%, and the Dow Jones index increased by 1.4%.
The yield on 10-year Treasury bonds dropped by around 20 basis points to its lowest level in a month and a half. Short-term bond yields also saw a significant decrease.
This was due to economic data revealing a slowdown in inflation in October, a more significant deceleration than economists had anticipated. Core inflation, excluding volatile food and energy prices, unexpectedly slowed to 0.2% from 0.3% in September.
Home Depot (HD) also exceeded analysts’ expectations in its third-quarter earnings report but lowered its full-year earnings outlook, reflecting a decline in consumer spending on some products and major projects.
Additionally, the U.S. House of Representatives approved a bill last night to avoid a government shutdown. This bill will be sent to the Senate for a vote. If lawmakers agree, the legislation will then move to President Joe Biden. However, without this funding bill, the federal government is set to shut down its operations at the end of this current week due to the debt issue.
The gains in the Nasdaq and U.S. stock indices came after the Consumer Price Index for October, a key measure of inflation, showed a decrease from the expected 0.1% increase forecasted by Dow Jones survey participants. The Consumer Price Index remained steady every month. As a result, the markets reacted positively to this news, leading to an increase in stocks in the hope that the Federal Reserve could finally halt the series of interest rate hikes.
I believe that the Consumer Price Index report triggered the recent wave of stubborn inflation in the market, confirming the contractionary trend and the imminent economic downturn. I do not anticipate the U.S. central bank lowering interest rates in the near term, as the housing market in the United States remains strong at present. This suggests that history is repeating itself.

From the above chart, we observe a similarity between the current inflation cycle and the pattern seen from 1966 to 1983. What does this mean? I believe that during that time, inflation occurred in waves, with each wave gradually becoming larger than its predecessor, leading to sharp liquidity withdrawals from the market afterward.
Therefore, if inflation continues on a similar path to what we see in the above chart today, the U.S. economy will face the final wave of inflationary increases, and it will be the worst ever from my perspective. Even the slight decrease in mortgage interest rates was sufficient to generate an increase in demand for mortgage applications last week.
The long-term decline in interest rates stimulates demand for mortgages and maintains upward pressure on housing prices. I believe this is the reason behind the Federal Reserve’s theoretical inclination to keep interest rates high for a longer period than expected. As a result, the markets are now issuing a serious warning and alert coinciding with the current upward wave.

Most economists repeat the same mistake they made during the 2008 financial crisis. Why? When we see economic indicators sharply contracting, signaling an impending recession, economists still anticipate an upward trend in financial markets. #There is a sharp market surge, as seen in 2008 when everyone expected the markets to continue rising despite strongly contracting economic indicators. Subsequently, the financial crisis occurred, and markets plummeted. The above chart speaks to that, and I believe it is a major warning signal for the markets!
One thing that may support this theory is the conflicting data regarding inflation. Recently, investors received more inflation data on Wednesday with the release of the Producer Price Index for October, which dropped to 1.3%, below expectations of 1.9%.
This marks the first decline in the Producer Price Index inflation in four months. At the same time, retail sales rose to 0.1%, higher than the expected -0.3%, which will lead to dollar volatility, and consequently, other markets will follow suit, fluctuating in the short term before collapsing from my perspective.
Inflation remains higher than the Federal Reserve’s long-term target of 2%. All evidence still points to the Federal Reserve having finished raising interest rates and entering a prolonged period of keeping them high.
Technical analysis of the Nasdaq (US100) prices
The various economic data indicate a clear recovery in the prices of American stock indices, especially the Nasdaq, which is currently trading near the 15895 level, a stubborn resistance zone hindering further upward movement on the index at present.
Yesterday marked the best daily performance for stocks and U.S. bonds in four months, as bets on Federal Reserve interest rate hikes decreased. Attention shifted to weak economic indicator figures, and the government shutdown, which had been a significant concern for a long period, was avoided, at least until next year.
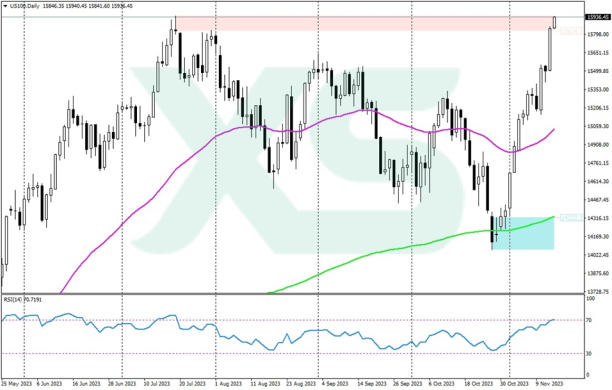
Nasdaq (US100) Prices Chart – MT4 Platform from XS.com
On the daily chart, if the Nasdaq 100 index successfully breaks above the resistance in the range of 15,895 and 15,800 points, and maintains stability above this range, which now represents a strong technical resistance, we may witness a price movement towards the highest level recorded in 2023 at 16,062 points.
However, in a bearish scenario, if sellers regain control and speculators on the rise start liquidating their long positions to take profits amid concerns of a potential correction after the recent upward trend, the next price support levels are situated at 15,500 and 15,400 points.
In the event of a breach of this support, we could see a decline towards 15,200, followed by 14,850. This could increase weakness in the long term, with the possibility of a decline towards 14,600 points or lower.


Leave a Comment