

A great indicator for assessing the strength or weakness of the S&P 500 is the percentage of stocks above their 50-day moving simple moving average (SMA).
When more than 50% of S&P 500 stocks are above their 50-day SMA it is generally a good time to own stocks.
When the indicator drops below 50% that usually indicates stocks are dropping or are choppy meaning it will be more difficult to make money on the long side in stocks.
Cory Mitchell, an analyst with Trading.biz, tracks two such indicators, he said, “I track one indicator that shows the percentage of all US stocks above their 50-day SMA, and another indicator that tracks the percentage of S&P 500 stocks above their 50-day SMA.
“When the indicator crosses above 50(%) and is rising, I more aggressively go long on swing trades in individual stocks. When the indicator is falling, I back off, and when it drops below 50% I stop buying stocks until the indicator crosses back above.”
The “all US stocks” version of the indicator tends to be more sensitive. It has been near 50% since February, indicating choppier trading. The S&P 500 version of the indicator stayed above 50% from November until April 24. The difference in the indicators shows many stocks were not participating in the S&P 500 rally over the last couple of months and signalled weakness under the hood.”
The indicator doesn’t pinpoint exact tops and bottoms, but rather captures the bulk of a trend and tends to keep a trader out when most stocks are choppy or declining.
The following chart shows the SPDR S&P 500 Trust (SPY) along with the percentage of S&P 500 stocks above their 50-day SMA.
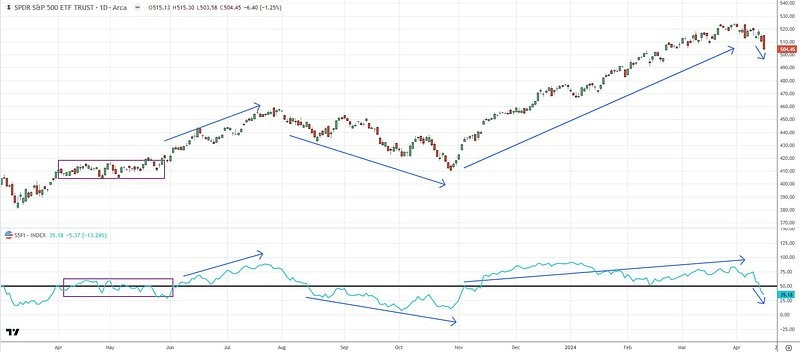 The indicator fell below the 50(%) line on April 24 for the first time since it moved above on November 14, 2023. Since this indicates that more than 50% are now in short-term downtrends, swing traders could consider waiting to buy the individual stocks they like until the indicator crosses above 50 again.
The indicator will sometimes whipsaw the 50 line. This is why Cory Mitchell uses the indicator to determine the aggression of capital deployment.
If the indicator is below 50, no long trades. As the indicator crosses above 50 from below, start adding positions. As the indicator keeps rising then add more positions assuming the individual stocks purchased are acting well. Get more aggressive as conditions get better. Continue to be aggressive while the stocks are moving up and the indicator is above 50.
As the indicator drops back to 50, back off, especially if noticing the stocks held are getting choppier or rolling over to the downside. This is a good time to close out trades or implement more aggressive trailing stop losses (move the stop loss close to the current price so if the prices drop further profits are locked in). As the indicator drops below 50, no new trades are taken until the indicator moves back above 50.
When the indicator will move back above 50 is unknown. This could be a brief pullback or it could last multiple months like it did in August, September, and October of 2023. Either way, the indicator is good at signalling when it is a good time to get back in.
 under pressure")


Leave a Comment