

2024 has been a great year for stock returns. The S&P 500 is up 7% in 2024 so far, including dividend payments.
January and February tend to be flatter months, but the S&P 500 moved higher in both of these months in 2024. March is the month when stocks usually start to see a resurgence.
According to Trading.biz analyst Cory Mitchell, said, “Usually January and February are months to avoid being invested in stocks, but in 2024 that hasn’t been the case.
“This shows that seasonality is simply a historic average, and doesn’t necessarily forecast what will happen in any given year. March tends to see more strength, followed by April which is even stronger.
“Even though the S&P 500 hasn’t followed the historic seasonal pattern so far this year, the S&P 500 is in an uptrend and the next two months tend to be strong. Consider staying invested as long as the uptrend remains intact.”
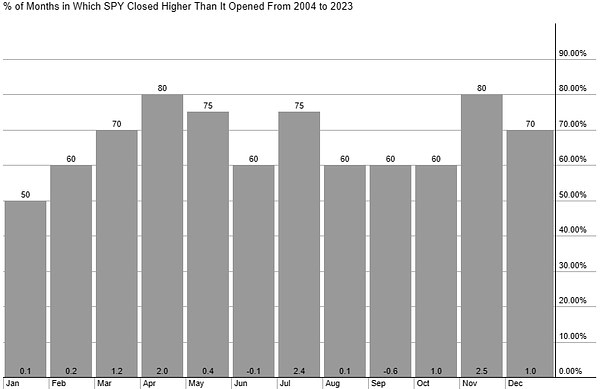
Over the last 20 years, the S&P 500 has moved higher in March 70% of the time, or 14 years of out 20. The average gain in March is 1.2%. This shows that stocks tend to start moving up compared to January and February which both have an average return of 0.1% and 0.2% and move higher 50% and 60% of the time, respectively.
April is one of the best months of the year for stocks. It has moved higher in April in 80% of the years (16 out of the last 20) for an average gain of 2%.
The following StockCharts seasonal chart shows how the SPDR S&P 500 ETF Trust (SPY) has performed in each month over the last two decades. The number at the top of the column is how often the price has moved in that month (percent). The number at the bottom of the column is the average return (percent) for the month.
The 5 Months Most Likely to Rally:
- March
- April
- May (rallies often, but lower average return than October and December, which are also decent months for stocks)
- July
- November
The 5 Worst Months:
- January
- February
- June
- August
- September
Using seasonality in stock trading
The study of monthly seasonality uses historical data. What will happen this March is unknown. Prices could continue to rally like they did in January and February, and history indicates that is slightly more likely than a down month.
Seasonality is generally combined with price action analysis and other forms of analysis for making trading decisions and is rarely relied on exclusively.
Overall, the stock market remains in an uptrend following the late 2023 pullback. The S&P 500’s pullback ended in October of 2023 and has rallied strongly since, with very few pullbacks. Between November 2023 and February 27, 2024, there have only been two pullbacks of more than 2%, and both were less than 3%.


Leave a Comment