

Nvidia Corporation (NVDA) was up more than 95% year-to-date before the price commenced a pullback on March 8.
In total, the price has fallen as much as 13.6% off its March high of $974.
Is this a buying opportunity or is the rally done for the time being?
Cory Mitchell, an analyst with Trading.biz said, “It is a bit too early to tell. In 2023 and 2024 pullbacks of less than 12% have resulted in the price moving higher.
“Pullbacks of more than that have indicated choppy trading and bigger declines. The current pullback is just over that 12% mark (13.6%). If the price starts heading higher very soon, this uptrend remains intact. If it declines a bit more, that indicates likely a month or more of choppy trading or a bigger decline.
“The fundamentals still look as good as the company’s earnings are growing strongly.”
In terms of fundamentals, the Price/Earnings is 67.6. At a glance that seems high, but the forward P/E is a more reasonable 28.7 based on 2026 earnings.
Analysts predict NVDA will grow its earnings by 30% per year over the next five years. Despite the earnings growth, much of this upmove has already occurred, even if there is some left.
Here are some other summary details on NVDA’s fundamentals:
- “A” financial health rating according to Morningstar
- EPS has grown an average of 48.3% per year over the last five years
- PEG forward is 1.0. PEG measures the current price versus expected earnings growth over the next five years. 1.0 is considered fairly valued.
The stock price is experiencing a bigger pullback than is ideal. Since late 2022 when the price has pulled back less than 12% following a strong rally, the rally tends to continue after the pullback. But if the price drops more than 12% following a rally, then choppier trading ensues or the pullback continues (drops more).
In late 2022 the price rallied 57% and then declined only 11.28% before starting to rally again. It rallied 25%. The next pullback dropped more than 12% and continued into a 26% decline.
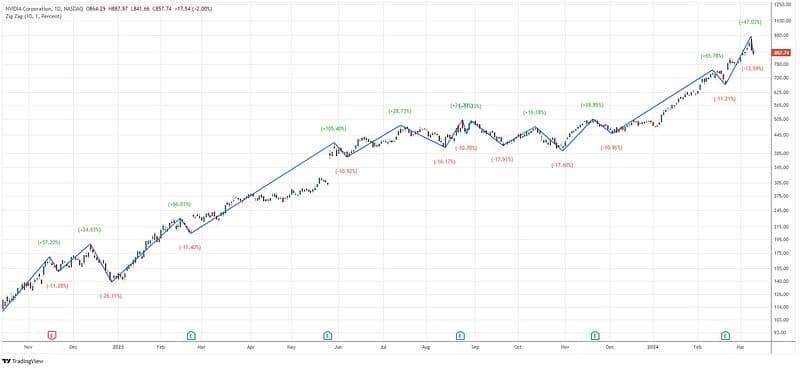 Following a 66% rally in early 2023, the price only declined 11.4% before moving higher and went 105%. The next pullback was only 10.9% and a 29% rally ensued. The next decline was 16% and choppy trading ensued for months.
From late 2023 into early 2024 the price rallied 66% and then declined only 11.2% before rallying again. It ran 47% before selling off 13.6% (the current pullback).
If this pattern continues, the price will either continue lower or expect choppy trading over the next couple of months. Choppy trading means little to no progress above the recent high of $974.
That said, history may not repeat. Manage risk on all trades.


Leave a Comment