

Historically February is a flat month for the S&P 500 and Nasdaq 100 indices.
The NYSE Composite, which includes companies of all sizes from different industries, tends to have negative returns in February. The one slightly brighter spot is the Russell 2000 index, composed of small-capitalization stocks.
Not only does the Russell 2000 move higher in February more often than the other indices, it also has a higher average gain. In a historically slow month, small caps tend to outperform. Below we consider whether that is likely to occur this year.
Here’s how each of the major indices has performed in February over the last 20 years.
- The S&P 500 has increased in February in 12 of the last 20 years (60%). The average return is 0.2%. Chart from StockCharts.
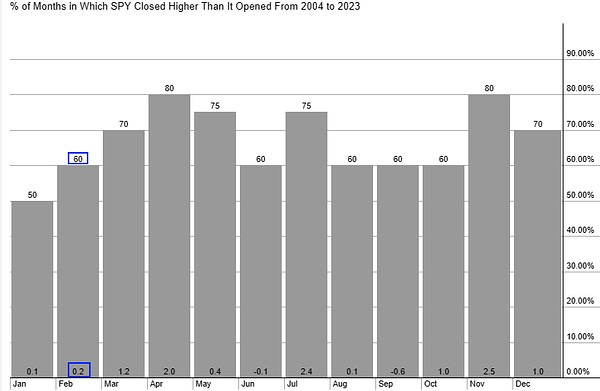
For comparison, the S&P 500 has averaged returns of 2.4% and 2.5% in July and November over the last 20 years.
- The Nasdaq 100 has increased in 8 of the last 20 years (40%) with an average gain of 0.2%.
The best month of the year for the Nasdaq 100 is July, with a 3.5% average return over the last two decades.
- The NYSE Composite has moved higher in February in 10 of the last 20 years (50%). The average loss is -0.1%.
April is the top month of the year for the NYSE Composite, averaging 2% returns.
Of these indices, the Russell 2000 is historically the top performer in February.
- The iShares Russell 2000 ETF (IWM) has moved higher in 13 of the last 20 Februaries (65%) and has an average gain for the month of 0.6%.
The Russell 2000’s top month of the year is November with a 2.9% average gain and moved higher 16 out of the last 20 years (80%).
The study of how assets move at different times of the year is called seasonality. Seasonality is backward-looking in that it studies history. While it may provide insights and statistics, it doesn’t forecast what will happen this February.
Cory Mitchell, an analyst with Trading.biz, stated “Seasonality is a tool, or one potential part of a strategy. A viable swing trading strategy also considers other factors such as position sizing, when to exit a winning trade, when to exit a losing trade, as well as context or market conditions such as whether the indices are in a bull, bear, or flat market. It’s currently a bull market in U.S. stocks.”
January, which has historically been similar to February in that it tends to be a flat month, has performed well. The SPDR S&P 500 ETF (SPY) is up 3.97% in January. With strong performance in January, that could indicate a forthcoming pullback in February, but its depth and how long it will last is unknown.
The Russell 2000 has been flat for the last two years, underperforming the S&P 500. With February tending to be a stronger month, the Russell 2000 could play catchup, but at the same time, the lackluster performance over the last two years can’t be ignored. The Russell 2000 is down in January. While history says otherwise, until the Russell 2000 starts performing better, the S&P 500 and Nasdaq 100 are moving better to the upside in this bull market.


Leave a Comment