

Bitcoin (BTC/USD) has confirmed a sharp shift in momentum, breaking out of its short-term uptrend and triggering bearish continuation signals on the 1-hour chart.
A failed breakout above $108,500 followed by an impulsive rejection now puts lower liquidity zones firmly in play.
- Bearish reversal confirmed after a fake-out above $108.5K and channel breakdown
- Retest of broken support aligns with 50% equilibrium zone, reinforcing downside bias
- Targets now set at $104.6K and $102K, pending support breakdown
The price initially respected a rising channel structure until a liquidity sweep near $108,500 hinted at distribution. Instead of following through higher, Bitcoin reversed sharply—trapping breakout buyers and confirming the move as a classic fake-out.
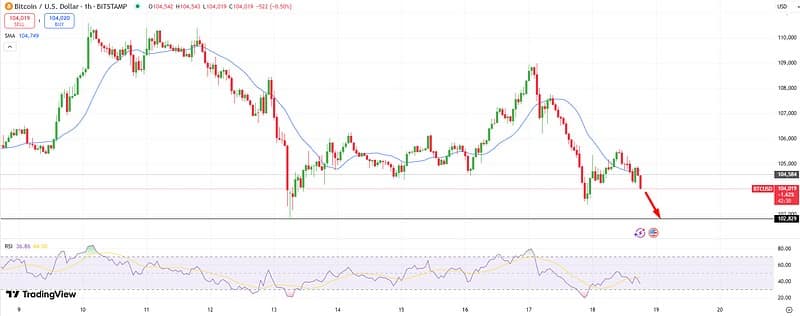
Following the breakdown, BTC has retested the underside of the channel, which coincides with the midpoint of the recent high-to-low range. This technical confluence supports a shift from accumulation to distribution.
Key technical levels:
- $107,000: Bearish invalidation
- $104,600: Immediate support from previous consolidation
- $102,000: Major liquidity zone and potential reversal point
According to Saqib Iqbal, Senior Analyst at Becoin.net, “As long as Bitcoin remains below the broken trendline and $107K, sellers are in control. We’re watching $104.6K as the first support test, followed by a potential flush to $102.8K if pressure builds.”
With market sentiment tilting bearish, traders are now closely eyeing downside targets and monitoring for signs of buyer re-entry at key liquidity zones.
Get real time update about this post category directly on your device, subscribe now.


 breaks historic winning streak amid earnings pressure and Fed anticipation")

Leave a Comment