

Bitcoin entered the week with relatively calm trading, but markets did not have to wait long before a violent shock unfolded. Within just a few hours, a whale offloaded nearly 24,000 BTC—worth around $2.7 billion—causing prices to tumble from $117,400 to nearly $110,000.
This sweeping move wiped out more than $550 million in leveraged long positions, exposing the fragility of liquidity over the weekend when the market’s ability to absorb such large transactions is typically weaker.
In my view, this episode serves as a harsh reminder that Bitcoin remains hostage to large capital flows and that bullish momentum remains vulnerable to violent corrections whenever major funds decide to rebalance.
What makes the situation more concerning is that this sell-off followed the classic pattern of a liquidity sweep, a familiar mechanism in institutional trading strategies where prices are driven into vulnerable areas to flush out excessive positioning before finding a new balance.
The timing—during the low-liquidity weekend—amplified the downside pressure. To me, this once again highlights how fragile crypto markets are to “liquidity hunting” techniques, leaving retail traders as the biggest losers whenever whales deliberately reshape the price map.
Beyond the whale-driven shock, the macroeconomic backdrop adds another layer of stress. The Federal Reserve’s latest warnings about the risk of stagflation—a toxic mix of weak growth and persistently high inflation—represent a paradigm shift for global markets. For Bitcoin, stagflation is a double-edged sword. On the one hand, it suppresses risk appetite in the short term, leading traders to dump high-beta assets like Bitcoin alongside tech stocks. On the other hand, the Fed’s limited ability to cut rates aggressively—without reigniting inflation—removes the liquidity tailwinds that historically fueled Bitcoin’s major bull runs. In my assessment, this twin challenge makes Bitcoin more vulnerable in the near term, even if its long-term appeal as a hedge remains intact.
From my perspective, the market is currently repricing Bitcoin. Once touted as “digital gold,” it is increasingly being treated like a growth stock. This shift forces traders to adopt a more realistic stance, managing risk carefully rather than relying solely on long-term narratives. Without a clear strategy and disciplined capital management, the likelihood of painful losses grows in proportion to volatility.
In contrast, Ethereum paints a more resilient picture. Despite Bitcoin’s sharp decline, the second-largest cryptocurrency managed to hold near $4,427, supported by hedging flows rotating out of Bitcoin. The firm defence of the $4,350 level underscores once again that Ethereum is not just a speculative asset but an income-generating ecosystem powered by decentralised applications and smart contracts. This divergence in performance leads me to believe that institutional investors are increasingly viewing Ethereum as a more stable pillar compared to Bitcoin—potentially reshaping the balance of dominance between the two assets. For me, Ethereum’s ability to hold above $4,350 keeps the door open for a move toward $4,700–$4,900, while Bitcoin must reclaim $113,000 to stabilise.
Technically, Bitcoin remains trapped in a compressed consolidation range, with $108,000 acting as the key liquidity zone. The inability to decisively break this level has created a temporary equilibrium, often a precursor to a strong impulsive move. I believe that any rebound above $113,000 would provide the bulls with the momentum to retest $116,000–$117,000, while a failure to hold above $111,000 would set the stage for a renewed test of $108,000 and potentially a slide toward $105,000 or even $103,000. This narrow range requires traders to rely on clear confirmation signals rather than guessing direction, as mistakes here can be costly.
Despite the clouded picture, JPMorgan’s latest report offers a more optimistic perspective. Analysts note that Bitcoin is undervalued by roughly $16,000 compared to gold, as its volatility has dropped to historical lows of around 30%—down from 60% at the start of the year. In my opinion, this decline in volatility is a critical development, as it supports greater institutional inflows, with large funds tending to favour lower-volatility assets. Should Bitcoin’s volatility converge further with gold, institutional allocations could start to align more closely, potentially boosting Bitcoin’s market cap by 13% and lifting prices toward the $126,000 region.
I believe the market stands at a critical crossroads. On one side, stagflation fears and whale-driven selling pressure could push Bitcoin lower in the short run. On the other hand, falling volatility and relative undervaluation versus gold create a fertile environment for new institutional capital. The irony is that the next major directional move may be decided not only by technicals or economic data, but also by how quickly institutions embrace Bitcoin as a strategic complement to gold.
Therefore, I see any further dip toward $108,000 as a potential accumulation opportunity—provided traders hedge carefully against the risk of a deeper slide to $103,000. Conversely, reclaiming $113,000 would gradually restore confidence and open the path toward retesting prior highs. Between fear and greed, the market remains delicately balanced, with all eyes now on the whales and the central bankers’ next move.
Technical analysis of Bitcoin ( BTCUSD ) prices
The daily chart of Bitcoin (BTC/USD) shows the formation of a potential reversal pattern after the price failed to hold above the 117,000–116,985 zone, triggering renewed selling pressure and pushing the coin to test the 111,580 level. The short-term trend remains weak with a clear bearish bias, driven by a gradual breakdown of the previous upward wave that started around 104,000. At the same time, the Stochastic indicator confirms this scenario, as it remains in oversold territory without showing any genuine bullish crossover, reflecting the absence of sufficient buying power to restore balance.

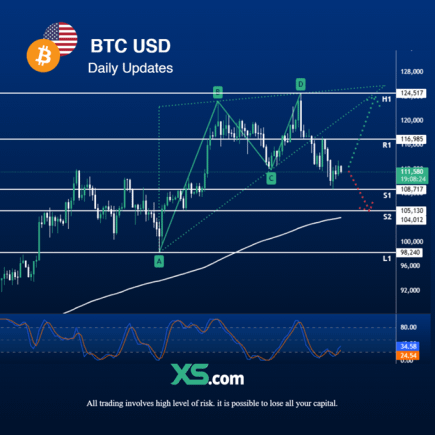
Structurally, the $108,717 level represents a key liquidity pivot and may act as a critical testing ground: a break below this level would quickly open the way toward the $105,130 – $103,012 zone, which is a crucial support area that could determine the next directional move. Conversely, any rebound from current levels would require a strong breakout above $113,000 at a minimum to confirm the recovery of momentum; otherwise, selling pressure is likely to remain dominant.
The most probable scenario in the coming days is continued sideways trading with a bearish tilt, as the market has currently lost the psychological backing of large buyers. At the same time, investors await the next sign of institutional liquidity. Holding below $111,000 strengthens the likelihood of a decline toward lower support levels, while a return above $116,985 would provide a strong bullish signal for a retest of the $124,517 highs.
Support levels: 108,717 – 105,130 – 103,012 – Resistance levels: 113,000 – 116,985 – 124,517
Get real time update about this post category directly on your device, subscribe now.

Leave a Comment